Just wanted to share what i think is a nice solution to encrypting your data. If you have confidential data that you would like to store securely, then have a look at EncFS. According to the man page, EncFS creates a virtual file system which stores encrypted data in one directory (they call this directory the rootdir) and makes it available unencrypted in another directory (mountPoint). The user must supply a password that would be used to encrypt the user's files and file names. EncFs relies on the underlying file system. Therefore if there are any limitations on the underlying file system, they will be inherited by EncFS.
One of the blogs that i follow (HowtoForge.com)has a nice write-up on using EncFS that I encourage you to check out. Below, I will provide a summary of the key commands that you will need to get up and running.
Install:
# apt-get install encfs
Create 2 directories needed by EncFS.
# mkdir ~/.confidential // This is a hidden directory
# mkdir ~/confidential
The ~/confidential directory will act as the mount point while the encrypted data and file names will be stored at the hidden directory, ~/.confidential.
Mounting the directory:
On first time run, you will be asked to select some preferences as well as your password. A config file will be placed in the ~/.confidential folder and it will be hidden (use ls -la to see this file). Once this is done, every time you run the same command, it will simply mount the unencrypted folder (~/confidential).
# encfs ~/.confidential ~/confidential
Unmount directory:
# fusermount -u ~/confidential
Thats the basics in a nutshell. I can envision this utility being used to encrypt certain folders in your home directory (Documents, Downloads, Music, Video) and then automatically have these folders mounted in their unencrypted form when a user logs in. A program like "expect" can be utilized to automate the password entry while being run via a log on script.
UPDATE:
It was brought to my attention via comments (Andy Chang), that a security audit performed on Encfs revealed some potential problems in the software. A report of the audit can be viewed here. In Summary, Encfs ignores many standard best-practices in cryptography. According to the report, this is most likely due to its old age (originally developed before 2005). The holes found in this audit do not suggest that Encfs is broken. However, there is potential (it is not-impossible) for the security be broken (very difficult to exploit) and thus makes the tool's overall security weaker.
Tuesday, March 11, 2014
Thursday, October 31, 2013
How I backup my server configs with lsyncd
In the event that something happens to my server, or one of the services running on my machine, I like to have a backup of my config for that particular service. Ain't nothing worse than taking hours or even days to properly configure a service to have a hard drive crash, operating system got corrupted, an update replaced your config file with the default or maybe you accidentally deleted the config or made some mistakes modifying it. This post shows how i use lsyncd and logrotate to automatically sync my /etc directory on my server with a remote machine and use logrotate to create and rotate 2 backup copies of the /etc directory.
The machines involved are main_server and backup_server.
On the main_server:
# apt-get install lsyncd
Lsyncd will use ssh as its network transport and we will need to create ssh keys for unattended remote login access. Lsyncd service runs as the root user so will need to login into the root account to create your ssh keys.
# ssh-keygen -t rsa
Copy your public key to the backup_server to allow password less login with ssh keys.
# ssh-copy-id backup_server
Try and logging to the backup server to see that you can authenticate to the backup_server without your password. If you run into issues, check the /etc/ssh/sshd_config file and ensure that public key authentication is enabled.
# ssh backup_server
Now we can create and configure lsyncd on the main_server. A config file is not created by default (on ubuntu and debian) so we need to create one.
# touch /etc/lsyncd/lsyncd.conf.lua
Now a simple config like this will suffice.
settings = {
logfile = "/var/log/lsyncd.log",
statusFile = "/var/log/lsyncd.stat",
statusIntervall = 1,}
sync{
default.rsyncssh,
source="/etc/",
host="backup_server",
targetdir="/root/backups/main_server/etc/"
}
Now we can start our service
service lsynd start
Hopefully everything went well and no errors occurred. Note that the location /root/backups/main_server/etc will need to be created(or atleast exist) prior to starting the lsyncd service .Now you can login to the backup_server and confirm that files and directories are being syncd.
At this point, you can create a logrotate config in /etc/logrotate.d/. Since logrotate runs via a daily cron job, our config will get executed daily. What our config will do is create a gzip'd tar archive of the /root/backups/main_server/etc/ and keep 2 copies while being rotated daily. The config will look like this.
# touch /etc/logrotate.d/main_server
# nano /etc/logrotate.d/main_server
/var/backups/main_server.tar.gz{
rotate 2
daily
create 644 root root
prerotate
rm /var/backups/main_server.tar.gz
tar -P -zcf /var/backups/main_server.tar.gz /root/backups/main_server
endscript
}
You will want to create a dummy main_server.tar.gz file to satisfy the first run of the prerotate script.
# touch /var/backups/main_server.tar.gz
We're all done. To recap, lsyncd will sync the /etc folder in near real time (few seconds of delay) from the main_server with the backup_server. And on the backup_server, a copy of the sync'd folder is backed up daily with logrotate, maintaining 2 rotated copies.
Resources / Good Readering:
1. https://www.digitalocean.com/
2. https://github.com/axkibe/lsyncd/
Friday, October 25, 2013
Reviewing boot logs on Debian
Recently, I installed a debian system as a server from the netinst CD. From the debian website:
The install was straight forward and i only opted to install standard utilities and nothing else. Everything installed successfully and the system booted without a single problem.
It is good practice to familiarize yourself with what you see on the console when your system boots up. Therefore in the event that something goes wrong and services aren't being started at boot, you would already be familiar with what your system usually does when it boots up. Typically, messages will indicate that your services were started "OK", something has "Failed", "Warning" notifiers, example: Starting periodic scheduler: Cron or some other service has failed. The issue that you will encouter is that these messages that you see on the console scrolls by very quickly and you usually only have about a second to recognize something useful.
By default, my new debian system did not log these boot messages anywhere. It turned out that bootlogd, the daemon that is responsible for logging these messages to "/var/log/boot" was not installed by default. Runnign # aptitude install bootlogd, was all that was needed. Once you reboot your system, boot messages will be logged to the file, "/var/log/boot".
You can simply cat the contents of the log file to view its contents but there is an issue where the colored strings are not escaped and you end up with bash color codes. These colored strings are what you see at boot with strings like "failed", "ok","warn", etc. To fix this you can view the logs with the following command
# sed 's/\^\[/\o33/g;s/\[1G\[/\[27G\[/' /var/log/boot | more
You can set up an alias for this in your .bashrc file to make life easier.
A network install or netinst CD is a single CD which enables you to install the entire operating system. This single CD contains just the minimal amount of software to start the installation and fetch the remaining packages over the Internet.
The install was straight forward and i only opted to install standard utilities and nothing else. Everything installed successfully and the system booted without a single problem.
It is good practice to familiarize yourself with what you see on the console when your system boots up. Therefore in the event that something goes wrong and services aren't being started at boot, you would already be familiar with what your system usually does when it boots up. Typically, messages will indicate that your services were started "OK", something has "Failed", "Warning" notifiers, example: Starting periodic scheduler: Cron or some other service has failed. The issue that you will encouter is that these messages that you see on the console scrolls by very quickly and you usually only have about a second to recognize something useful.
By default, my new debian system did not log these boot messages anywhere. It turned out that bootlogd, the daemon that is responsible for logging these messages to "/var/log/boot" was not installed by default. Runnign # aptitude install bootlogd, was all that was needed. Once you reboot your system, boot messages will be logged to the file, "/var/log/boot".
You can simply cat the contents of the log file to view its contents but there is an issue where the colored strings are not escaped and you end up with bash color codes. These colored strings are what you see at boot with strings like "failed", "ok","warn", etc. To fix this you can view the logs with the following command
# sed 's/\^\[/\o33/g;s/\[1G\[/\[27G\[/' /var/log/boot | more
You can set up an alias for this in your .bashrc file to make life easier.
Thursday, June 6, 2013
Authenticating an Stunnel server to an Stunnel client
Stunnel can take care of our network encryption needs for any TCP connection. I blogged about setting this up here. Stunnel makes use off SSL certificates which enables us to achieve these 3 main things, 1. Authentication, 2, Confidentiality and 3, Integrity. If you referenced my first post about stunnel, you may or may not have realized that i did not make use of the "authentication" feat of SSL. In this post, i aim to achieve that.
Essentially, the client will be able to connect to the server and verify that it's indeed connected to the correct server. By default the client will communicate with any stunnel server and accept the server's certificate without taking extra steps to verify it. What this means is that a malicious person can potentially setup a rogue stunnel server with their own certificate and pose as a ligitimate server. Because your client accepts everything blindly, it will make the assumption that it is connected to the right server, when indeed it might not be. Lets fix that.
Step 1. Generate private key, certificate and PEM file.
# openssl genrsa -out server.key 2048
# openssl req -new -x509 -nodes -days 365 -key server.key -out server.crt
# cat server.key server.crt > server.pem
# chmod 640 server.pem
# chmod 640 server.key
Step 2. Run stunnel server.
# stunnel -f -d 443 -r 127.0.0.1:80 -p server.pem -s nobody -g nogroup -P /tmp/stunnel.pid
Step 3. Copy ONLY server.crt file to clients that would be connecting to the stunnel server. The server.pem and server.key file MUST be kept secret at all times.
Step 4. Run client with extra option -v 3 to enable certificate verification via locally installed cert.
# stunnel -c -f -d 443 -r remote.server.com:443 -v 3 -A server.crt
Thats it.
If a malicious person tries to impersonate your server,it will fail to pass these checks:
1. When the initial connection between client and server is made, the server sends its certificate to the client. The client would only accept this certificate if it is within it's white list of certs "-A option".
2. If for some reason the malicious person was able to have the server send the correct cert, the client would challenge the server to prove that it has the matching private key for the cert. Because the malicious user does not have the private key and is unable to prove that it does, the client will terminiate the session.
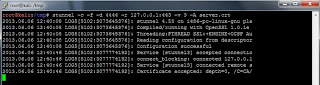
Here is a screenshot of what things look like on the client under normal working conditions.
Here is a screenshot of what will happen on the client if a malicious server is used to impersonate a legitimate one.

The way we have setup stunnel we achieve the three main goals of SSL certificates.
1. Authentication. Server authenticates itself to the client before communication is established.
2. Confidentiality. Session is encrypted using symmetric cryptography.
3. Integrity. Ensures that the encrypted data has not been tampered with via a negotiated hashing algorithm.
Essentially, the client will be able to connect to the server and verify that it's indeed connected to the correct server. By default the client will communicate with any stunnel server and accept the server's certificate without taking extra steps to verify it. What this means is that a malicious person can potentially setup a rogue stunnel server with their own certificate and pose as a ligitimate server. Because your client accepts everything blindly, it will make the assumption that it is connected to the right server, when indeed it might not be. Lets fix that.
Step 1. Generate private key, certificate and PEM file.
# openssl genrsa -out server.key 2048
# openssl req -new -x509 -nodes -days 365 -key server.key -out server.crt
# cat server.key server.crt > server.pem
# chmod 640 server.pem
# chmod 640 server.key
Step 2. Run stunnel server.
# stunnel -f -d 443 -r 127.0.0.1:80 -p server.pem -s nobody -g nogroup -P /tmp/stunnel.pid
Step 3. Copy ONLY server.crt file to clients that would be connecting to the stunnel server. The server.pem and server.key file MUST be kept secret at all times.
Step 4. Run client with extra option -v 3 to enable certificate verification via locally installed cert.
# stunnel -c -f -d 443 -r remote.server.com:443 -v 3 -A server.crt
Thats it.
If a malicious person tries to impersonate your server,it will fail to pass these checks:
1. When the initial connection between client and server is made, the server sends its certificate to the client. The client would only accept this certificate if it is within it's white list of certs "-A option".
2. If for some reason the malicious person was able to have the server send the correct cert, the client would challenge the server to prove that it has the matching private key for the cert. Because the malicious user does not have the private key and is unable to prove that it does, the client will terminiate the session.
Here is a screenshot of what things look like on the client under normal working conditions.

Here is a screenshot of what will happen on the client if a malicious server is used to impersonate a legitimate one.

The way we have setup stunnel we achieve the three main goals of SSL certificates.
1. Authentication. Server authenticates itself to the client before communication is established.
2. Confidentiality. Session is encrypted using symmetric cryptography.
3. Integrity. Ensures that the encrypted data has not been tampered with via a negotiated hashing algorithm.
Tuesday, February 26, 2013
SSH tunneling made easy with sshuttle.
It amazes me how many things you can do with ssh. They say netcat is the swiss army knfie networking tool, but ssh would be like the swiss army knife networking protocol. We know ssh is mainly used for remote administration via a terminal or command prompt, but it can also be used for other things like the tunneling of TCP connections. If you are familiar with this process, then you know how neat this can be, but configuring each port to be tunneled can get ugly. However, there is a cleaner and simpler way for tunneling your tcp connections over ssh using sshuttle. What you ultimatly get is a poor mans VPN. Once sshuttle is running, all your traffic will be proxied through an ssh connection (dns traffic can also be proxied if told to do so).
Here is an example of how i use sshuttle.
# ./sshuttle --dns -r username@remoteip.com 0/0
Resources / Good Reading:
sshuttle github
Here is an example of how i use sshuttle.
# ./sshuttle --dns -r username@remoteip.com 0/0
Resources / Good Reading:
sshuttle github
Thursday, November 8, 2012
Configuration management with puppet
Scenario:
How do you manage the configuration and management of multiple servers (25 plus nodes) in an effective manner?. Say we want to setup the ssh service on 20 servers, configure the service to meet our needs, then reload the service for the changes to take effect. This would involve you doing this manually for each system (can't be done remotely with ssh cause its not installed yet ).What if it was for another service like an ftp server. You can configure one server then scp the config file(s) to each of the 20 machines, then issue the commands to restart the service for the changes to take effect. OK that works, but its only 20 machines. This clearly doesn't scale up very well when you need to mange hundreds of systems. Clearly there must be a better way. My solution to such a problem is puppet.
Puppet is an open source configuration management written in ruby. It allows you to automate many task across many unix-like systems (windows integration is still in the works) including the installation of packages, configuration of services, creation of users, execution of bash commands and more. It is based on a client-server model. The server (which is called the puppetmaster) will contain the definitions that essentially determines the end state or how things should be on the nodes, for example: what services should be installed, what config files should be downloaded to these nodes, etc. The client (callet the puppet) will poll the server every 30 minutes by default, for these "state" definitions and process them. The client will compare its state with these definitions, and make the necessary corrections where necessary.
I came across some useful tutorials and resources that will get you up on running quickly. The configuration syntax does take some getting used to but if you are like me, you can adapt quite easily after looking at some examples.
Resources / Good reading:
http://puppetlabs.com
http://en.wikipedia.org/wiki/Puppet_(software)
www.linuxjournal.com
http://bitfieldconsulting.com/puppet-tutorial
http://www.debian-administration.org/articles/526
Monday, October 8, 2012
Protecting your services with fail2ban
There is no one solution that takes care of your network security. Protecting your services from the bad guys is quite complex and involved. Lets say we wanted to protect our openssh service for example; there are quite a few things that can be done in order to improve its security.
The first thing you would want to do is ensure that you have the latest version of openssh. You should also setup a mechanism that will check for updates regularly. Next is configuration. Server software can be quite complex to configure securly and openssh is no exception. Once your configs are all polished, there is still one attack vector that still could impact us, bruteforce attacks. Unfortunately, openssh doesn't have a feature that we can configure or enable that prevents bruteforce attacks. However there is a project, fail2ban, that can protect us from such attacks.
Fail2ban has been around for almost 5 years and simply works. It works by monitoring log files (in openssh's case, the auth.log file found on debian bases systems in /var/log/) for signs of failed login attempts. When it detects a number of failed attempts for a given duration of time, it can block the offending IP address using iptables and also send an email to the system admin. Fail2ban doesn't just work for openssh but can be configured to work for any service that logs fail logging attempts. See the links below for examples and details for configuring fail2ban for your services.
Resources / Good reading:
fail2ban.org
https://help.ubuntu.com/community/Fail2ban
http://www.howtoforge.com/fail2ban_debian_etch
http://www.the-art-of-web.com/system/fail2ban/
Subscribe to:
Posts (Atom)